Dashboard
Dashboards are a data visualization tool that allows all users to understand the analytics that matters to their business, department, or project. Even for non-technical users, dashboards allow them to participate and understand the analytics process by compiling data and visualizing trends and occurrences.
You can easily identify the Product and its count, Customers, Orders, and Shipped Orders.
Load the data from Current Week, Current Month, Current Year, or All. By default, it loads current week data.
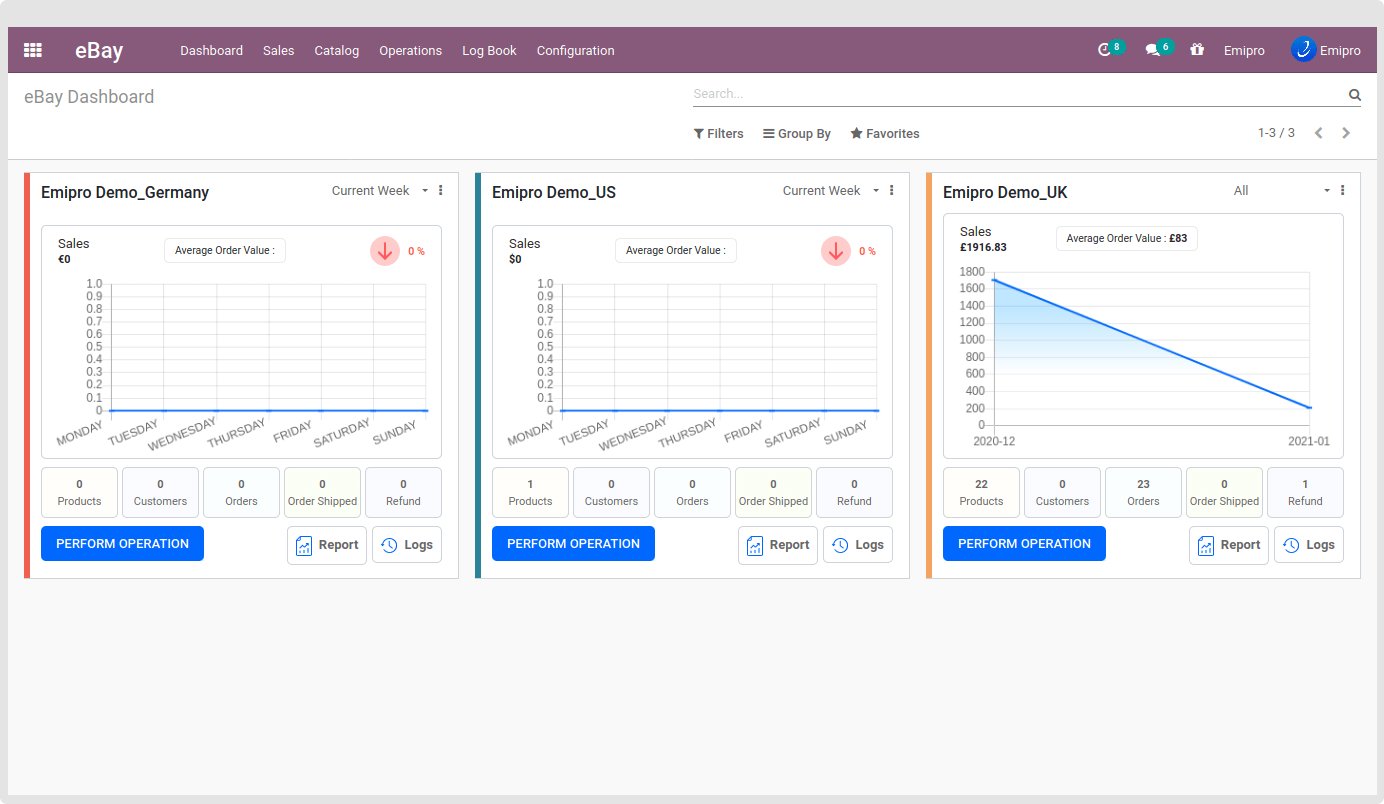
Now go to the Dashboard. All the loaded data and its count will be based on your configuration.
Below is the Smart Button in the kanban view.
- Products
Load those eBay Layer Product Templates in which the selected Instance is set.
- Orders
Load and display the Order count based on the selected instance. Display total count of sale orders.
- Order Shipped
Load and display those order counts which delivery is in the Done state. Here consider only that delivery which stock_location is “Customer”.
- Refund
Load and display the order refund counts based on the selected instance. Display total number of refunds.
By clicking on the above smart buttons, you will directly jump to the respected action’s view.
Easily get the Sale Order Reports
Easily identify the log.
Easily Perform any operation by clicking on the “Perform Operation”.
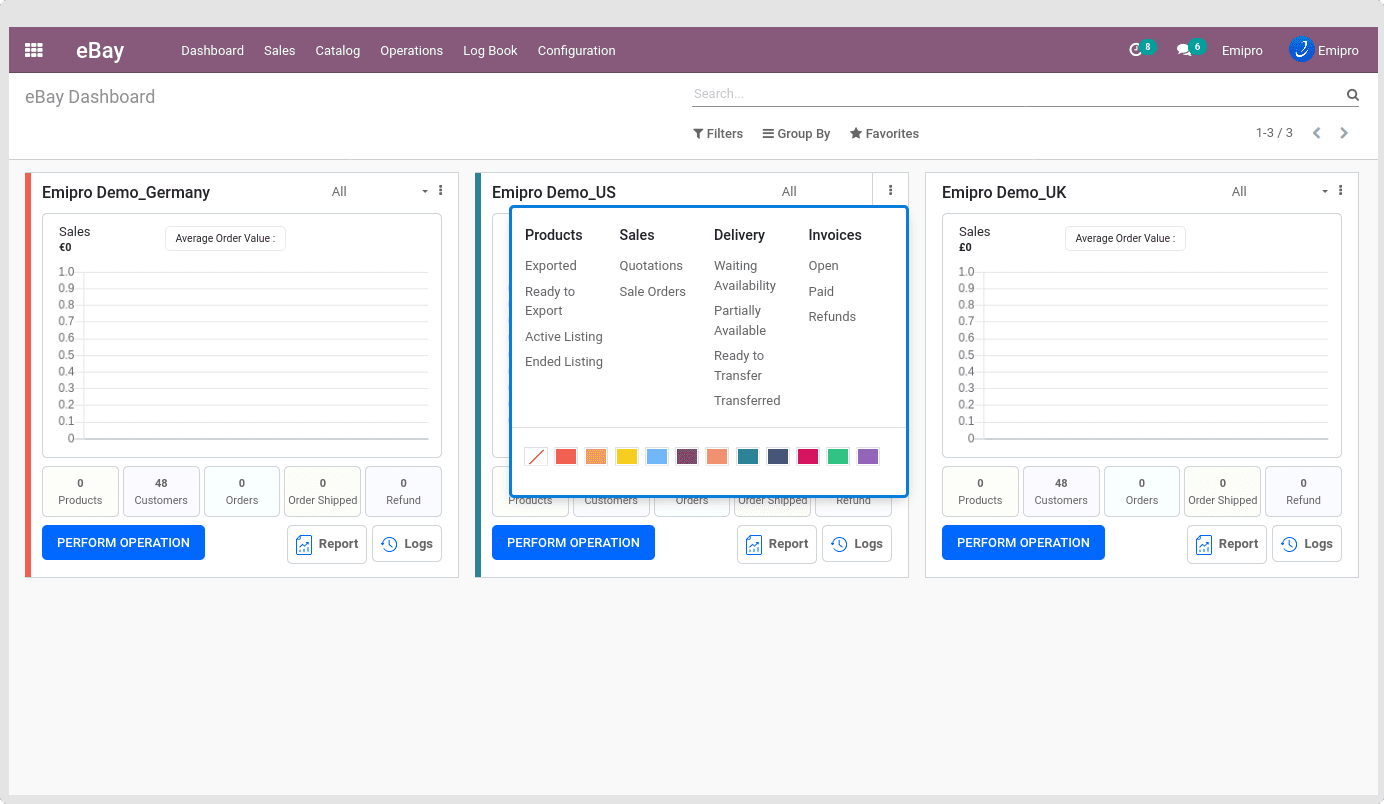
By clicking on the vertical three dots, you will find the best option to analyze your instance.